SSC CPO 2020 objective Ques (54 results)
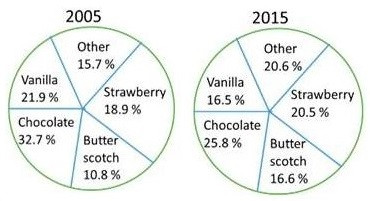
SSC CPO 20201)The given pie charts represent the popularity of ice-cream flavours in the years 2005 and 2015.
If a percentage point shift results in annual additional sales of Rs. 10,000, how much (in Rs.), did the combined annual strawberry and butterscotch sales increase from 2005 to 2015?
Rs. 74,000
SSC CPO 20202)The given bar graph shows the number of students of two schools over a period of six years.
In the bar graph, what is the ratio of the average of the total students from school A to the average of the total students from school B?

429 ∶ 370
SSC CPO 20203)The given bar graph shows the number of students of two schools over a period of six years.
In the bar graph, in which year is the sum of the students from schools A and B taken together, the minimum?
2010
SSC CPO 20204)The given histogram shows the height of the students.
The number of students whose height is in the class interval 170-175 is what percent less than the number of students whose height is in the interval of 165-170? (correct to one decimal place)
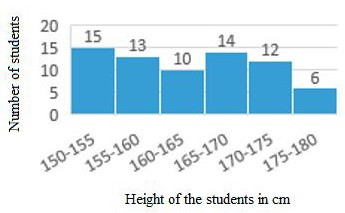
14.3%
SSC CPO 20205)The given histogram shows the height of the students.
What is the percentage of students whose height is in the class interval of 160-170? (correct to the nearest integer)
34
SSC CPO 20206)The given bar graph shows the number of students of two schools over a period of six years.
In the bar graph, what is the ratio of the students taken for the years 2009, 2011, 2013 together from school A to the students taken for the years 2008, 2012, 2013 together from school B?
25 ∶ 17
SSC CPO 20207)The given pie chart represents the popularity of ice-cream flavours in the year 2005.
In 2005, if 10% of the 'other' category is mix fruit flavour and 1570 people surveyed preferred mix fruit flavour, then how many people were surveyed?
1,00,000
SSC CPO 20208)The given histogram shows the height of the students.
The difference between the number of students whose height is between 150-155 cm and the number of students whose height lies between 175-180 cm is:
9
SSC CPO 20209)The given pie chart represents the popularity of ice-cream flavours in the year 2015.
In 2015, if the total sale of vanila flavour is for Rs. 3,300 then the total sale (in Rs.) for chocolate flavour is:
Rs. 5,160
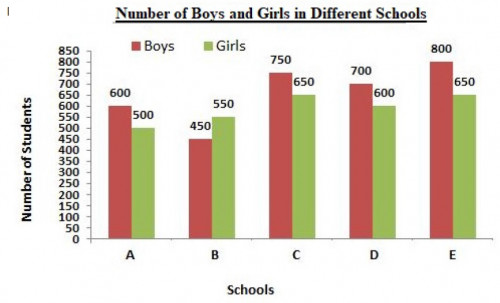
SSC CPO 202010)The given bar graph represents the number of boys and girls in five different schools. Study the graph and answer the question that follows.
What is the average number of boys in schools A, B, C, D and E?
, did the combined annual strawberry and butterscotch sales increase from 2005 to 2015?)
, did the combined annual strawberry and butterscotch sales increase from 2005 to 2015?**%0D%0AA%29 Rs. 65,000%0D%0AB%29 Rs. 10,000%0D%0AC%29 Rs. 74,000%0D%0AD%29 Rs. 37,000 %0D%0AClick Link for Answer)
)
**%0D%0AA%29 11.5%%0D%0AB%29 17.3%%0D%0AC%29 14.3%%0D%0AD%29 19.5% %0D%0AClick Link for Answer)
)
**%0D%0AA%29 39%0D%0AB%29 34%0D%0AC%29 25%0D%0AD%29 51 %0D%0AClick Link for Answer)
 for chocolate flavour is:)
 for chocolate flavour is:**%0D%0AA%29 Rs. 5,160%0D%0AB%29 Rs. 4,100%0D%0AC%29 Rs. 4,120%0D%0AD%29 Rs. 3,320 %0D%0AClick Link for Answer)
660